The CodA (=Codon Analyzis) takes a set of sequences in fasta format and calculates 4 different value sets, either presented as graphs or in a (big) table.
Execute
After downloading you can start the application by entering
java -jar /path/to/coda.jarin a terminal.
Input
The header lines of the fasta files must have at leat following structure:
>gi|<u>13383272</u>|gb|AB049156| /<u>Avian</u>/2(PB1)/H9N2/Japan/19The first underlined part consists of the id, the second of the host. The id is taken as an identifier for analyzations. That means the first two "|" characters is a must to have!
Graphical representation
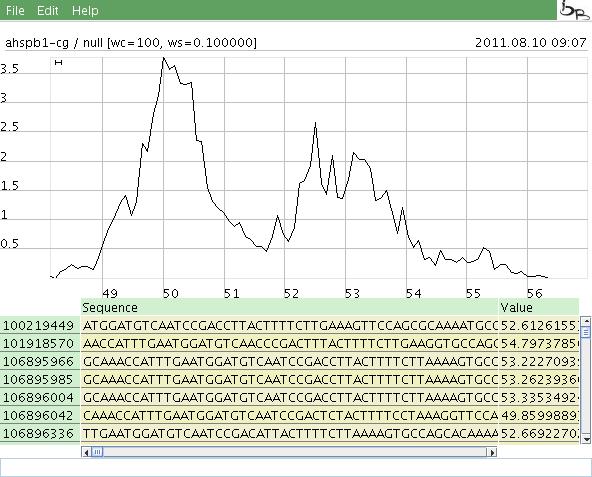
The first three value sets are 2-dimensional graphs displaying CAI (=Codon Adaptation Index) or ENC (=Effective number of codons) values for the sequences. The ENC calculation has a second (slightly different) method, called ENC2, which is using a method of John A. Novembre (see here). It consideres the number of used codons in correlation to the statistical expected numbers in the sequence.
- Select a value range: Clicking in the graph with the left mouse button selectes the minimum x value of a selected area, clicking with the right button the maximum value. The selected range is displayed in a table below the graph.
- Move a graph: Pressing the lefe mouse button and moving the mouse lets you move the graph to the disired position.
- Scale a graph: Just turning the wheel lets you scale the display.
The values are not displayed as (individual) dots or lines, instead the density is calculated in "windows" of a specified size. The window is moved through the range of the cai or enc values. The point is printed at (x+windowsize/2,den), where den is the density value of points in the range [x..x+windowsize]. The density value is calculated as the density of values in the window area divided by the total density of values in the whole value range (=(count/w)/(countg/(wg))). A value of 1 means the density in the window is the same as the density of the whole value range. The points are connected so a graph is drawn that shows a somehow "statistical" behaviour of the data. (Note: Using this method a single value which is "out of range" will not change the graph dramatically.) More common: On the x axis the cai/anc values are presented on the y axis the desity of values in a specified window is shown. The window size and count, the analyzation method and the host which will be analyzed may be specified in a separater parameter dialog. The host may be omitted, so every input sequence is considered.
Parameters
Parameters are specified in a dialog opend in Edit -> Set Parameters
- Host: Select a host. That means only fasta data is taken into calculation which has the specified host.
- Method: The 4 different methods of claculation
- Window count: This value specifies the number of calculations in the value range of the result. It has only effect when selecting CAI, ENC or ENC2 method.
- Window width: This value specifies the size of the window which is moved through the summed up the values in the value range of the result. It has only effect when selecting CAI, ENC or ENC2 method.